Acumulación en VIX

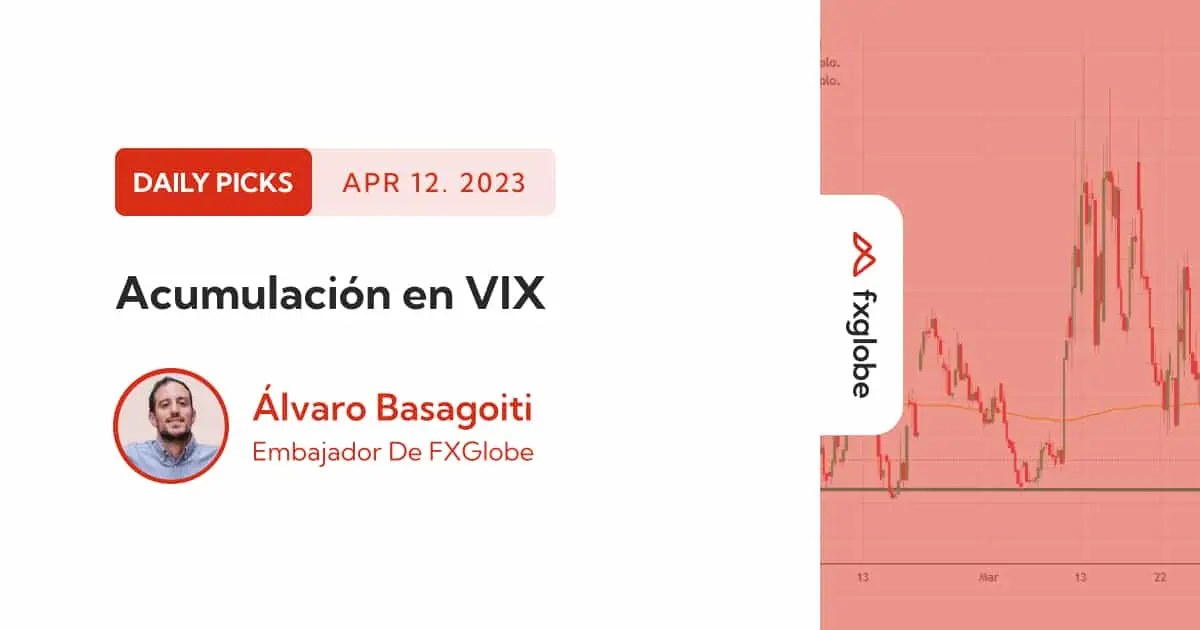
El VIX es el índice que mide la volatilidad del S&P500, también conocido como el índice del miedo. El precio ha llegado a una zona de muy importante soporte, como veis en el gráfico que os compartimos abajo, que está marcada con esa línea verde extendida. Sabemos que las zonas de acumulación y distribución funcionan mejor sobre niveles relevantes de soporte y resistencia.

El precio está realizando una fase de lateralización. Ahora hay que ver por donde rompe, si por arriba o sigue marcando nuevos mínimos o barribas. En caso de que nos quiebre la clavicular, esperaríamos a ver un buen pullback (con poco volumen), para poder buscar compras. Siempre hay que esperar la confirmación. Y como ya sabéis, nosotros no operamos en rotura, sino en pullback. Recuerdo que esto no son recomendaciones de inversión.

VIX (H4)

erez

Trading Advice Disclaimer:
Our Ambassador’s Daily Picks are not trading advice. These are informational articles covering the events which happened in the market already & scheduled events which are scheduled to happen in the Economic & Earnings Calendar.

General Risk Warning:
Trading leveraged products such as Forex and CFDs carries a high level of risk thus may not be appropriate and/or suitable for all investors. The investment value can both increase and/or decrease and the investors may lose all their invested capital. The content of this website does not constitute financial or investment advice. Any information herein is of a general nature and does not take into consideration your personal circumstances, investment experience or current financial situation. Under no circumstances shall the Company or affiliated Companies have any liability to any person or entity for any loss or damage in whole or part caused by, resulting from, or relating to any transactions related to leveraged products.